Ofsted Report Cards: Poorer Pupils Trail on Results
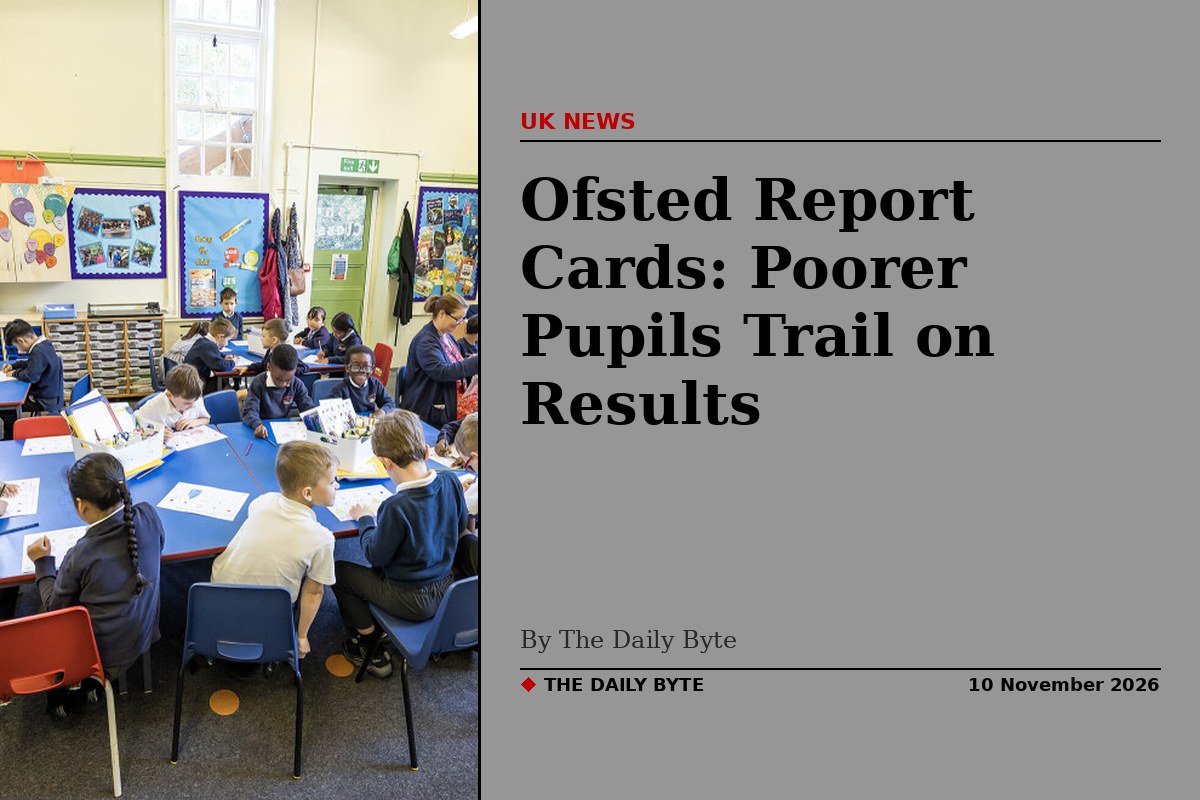
Ofsted has published the results of the first full year of its new school report cards, and the headline is a gap, not a grade. Across 3,262 inspections carried out between 10 November 2025 and 31 August 2026, schools in the most deprived areas were far less likely to reach the expected standard for achievement than schools serving better-off communities.
The figures, published on 10 November 2026, cover the first academic year of the renewed inspection framework, which replaced single-word judgements with report cards grading schools across six core areas on a five-point scale. Of the inspections carried out, 3,188 were full inspections, covering about 15 per cent of England's 21,957 state-funded schools.
What the first year found
Achievement was the weakest area. Only 72 per cent of schools inspected were graded at the expected standard or better for achievement, the lowest of any core area. By contrast, 95 per cent reached that bar for personal development and wellbeing, 90 per cent for inclusion, 85 per cent for leadership and governance, 84 per cent for attendance and behaviour, and 78 per cent for curriculum and teaching.
More than a quarter of schools, 26 per cent, were rated as needing attention for achievement, and 2 per cent were given the lowest grade, urgent improvement. Across all six areas, 37 per cent of inspections produced at least one grade of needs attention or urgent improvement, while 4 per cent of schools were graded exceptional in at least one area. Eleven schools were graded exceptional in every area they were assessed on.
The disadvantage gap
Analysis of the data by Schools Week found a clear link between deprivation and results. Among schools with the most deprived intakes, 62 per cent reached the expected standard or better for achievement. Separate analysis by FFT Education Datalab looked at 65 secondary schools in the top quarter for both the share of pupils with special educational needs and the share eligible for free school meals. Only 30 per cent of those schools reached the expected standard or better for achievement, compared with 71 per cent of secondaries overall.
The same pattern showed up in attendance and behaviour, where grades also tracked deprivation. Ofsted itself cautions that the schools inspected in a single year are not a representative sample of all schools, because lower-performing schools are inspected more often than high-performing ones. Even so, the correlation between disadvantage and grades is consistent across the areas inspectors assessed.
Safeguarding held up in almost all schools
Safeguarding standards were met in 99 per cent of full inspections. In the 18 schools, 0.6 per cent, where safeguarding was judged not to have been met, it was rarely the only weakness found. All but one of those 18 schools were also graded urgent improvement for leadership and governance, and 13 were graded urgent improvement in at least one other area.
Schools given an urgent improvement grade in any area are placed in a category of concern and receive follow-up monitoring inspections. Ofsted began a new style of improvement monitoring inspection in June 2026, and six of these were published in time for this release. In one case the monitoring inspection became a full inspection, safeguarding was judged to have been met, and the school was taken out of the category of concern.
What happens next
The report card system is now the settled way schools are judged, and this release sets the baseline against which future years will be measured. The question it leaves open is the one the data keeps pointing at: whether schools serving the most disadvantaged pupils get the support they need to close a gap that inspection alone can only describe. Read the official figures in full on GOV.UK, and the analysis of the disadvantage gap in Schools Week.