UK House Prices Fall 1.2% in Steepest Drop Since 2023
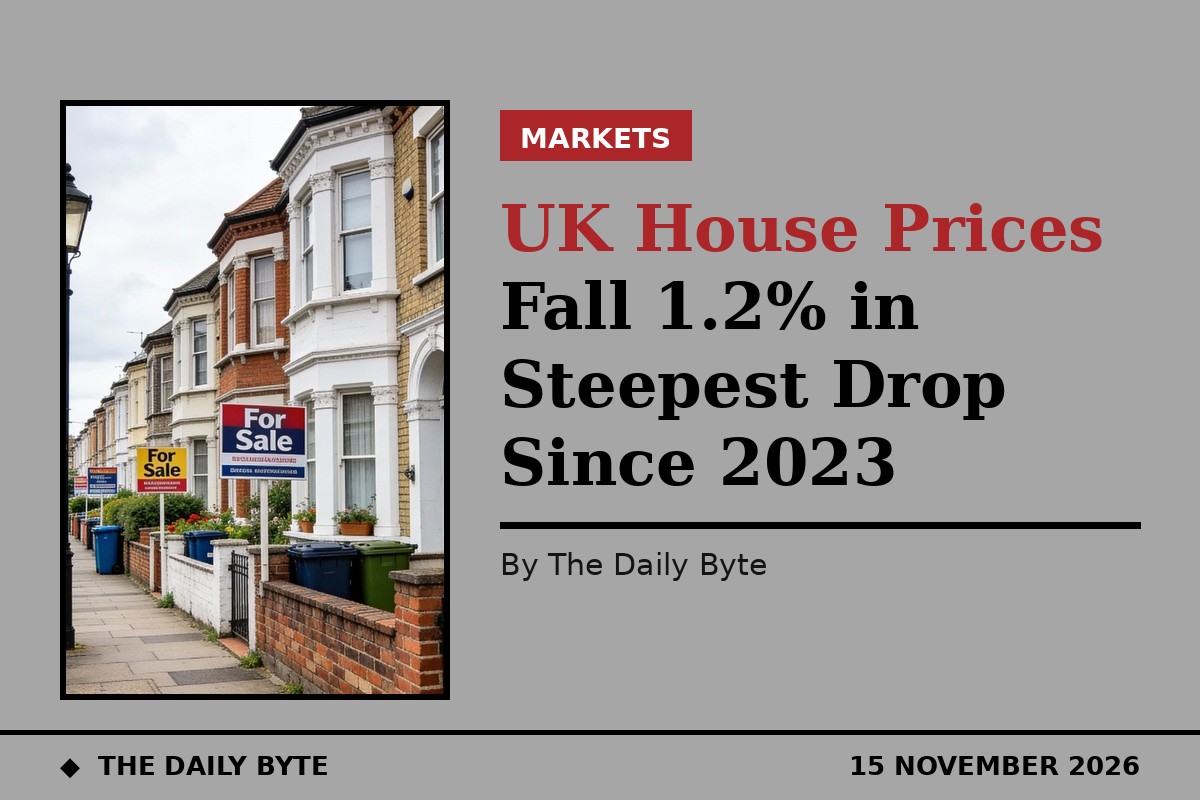
UK house prices fell by 0.6% in October to an average of £296,285, leaving values 1.2% lower than a year earlier in the steepest annual decline since October 2023, according to the Lloyds House Price Index published on 6 November 2026.
The monthly fall followed a 0.1% dip in September, making October the fourth consecutive month of declines. Prices are now 0.5% lower over the latest three months. The result was far weaker than economists had expected: the consensus had pointed to a 0.1% monthly rise and an annual fall of only about 0.3%.
London recorded the sharpest regional fall, with prices down 3.1% over the year to an average of £524,892. The South East and South West both fell by 2.4% annually. By contrast, the North West rose 2.2% and the North East 2.0% over the same period, while the West Midlands edged up 0.3%, underlining a widening north-south divide in the housing market.
Higher rates bite
The figures landed the morning after the Bank of England raised Bank Rate to 4% on 5 November 2026, its first increase in more than three years. Rising swap rates have pushed mortgage costs higher, with the average two-year fixed rate reaching 4.35% at the start of November, up from 4.19% at the start of October. Lloyds said weakening demand drove the slowdown as higher borrowing costs weighed on buyers.
Savills separately revised its five-year forecast on 5 November, and now expects mainstream UK house prices to fall by 1.5% in 2027, with no recovery until 2028. That would complete a peak-to-trough decline of around 3.0% from the mid-2026 high.
Other measures tell a softer story
Not every index agrees on the scale of the downturn. Nationwide's separate October index, published on 30 October, showed prices flat on the month with annual growth slowing to 0.5%. The official ONS index, based on completed sales rather than mortgage approvals, put annual growth at 0.9% in August 2026, with an average price of £273,000. The lender indices and the official figures measure different stages of a sale, so they often disagree from month to month.
Lloyds said the market was likely to stay subdued in the near term, but added that it did not expect the fall to turn into a sustained period of declining prices. Prices have changed relatively little over the past two years as the market adjusted to higher rates, and the bank's view is that the current weakness reflects affordability pressure rather than the start of a crash.
For buyers, the data points to more room to negotiate, particularly in London and the south, where sellers are increasingly cutting asking prices to secure a sale. For owners, the figures are a reminder that the post-2024 recovery in prices has stalled. Attention now turns to official UK labour market figures due on 17 November, which will show whether wage growth is still running ahead of house prices.
Sources: Landlord Today and Find UK Property, both reporting the Lloyds House Price Index for October 2026, published 6 November 2026.