US Treasury 10-Year Yield Hits 5.15% on 13 November
By The Daily Byte
·14 Nov 2026
·4 min read
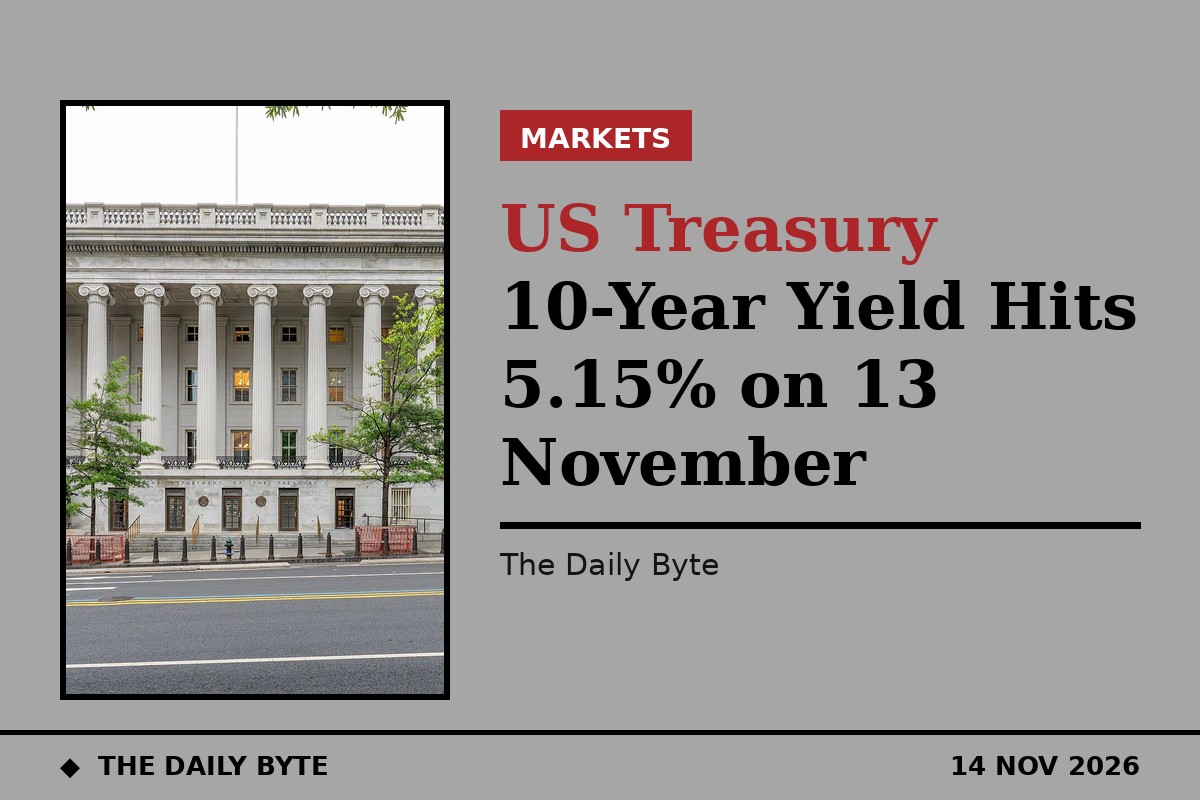
The US 10-year Treasury yield closed at 5.15% on Friday 13 November 2026, its highest level in almost a month, after a week in which hotter inflation data and hawkish talk from Federal Reserve officials pushed borrowing costs higher across the curve.
The yield rose five basis points on the day, according to the US Department of the Treasury's daily par yield curve rates, and has climbed 27 basis points since Monday 9 November. A year ago the 10-year yield stood at 4.11%.
## What the Treasury curve showed on 13 November
The Treasury's published curve for Friday put the two-year yield at 4.88%, up two basis points on the day, and the 30-year yield at 5.47%, up four basis points. The three-month bill yielded 4.32%, the five-year note 4.98% and the seven-year note 5.05%. The 20-year yield stood at 5.52%.
The gap between the two-year and 10-year yields was 27 basis points, with the longer maturity above the shorter one, so the curve was not inverted. The effective federal funds rate was 3.88% on 12 November, inside the Federal Reserve's target range of 3.75% to 4.00%.
Market reports put the 10-year yield slightly higher during Friday trading, at 5.156%, after the US Labor Department published its producer price inflation report for October. Bond prices fall as yields rise, and Friday's selling left the benchmark at its highest since late October.
## Why yields rose this week
The move was driven by signs that inflation is proving persistent and by expectations that the Federal Reserve could raise interest rates again. The 10-year yield stood at 4.86% on Friday 6 November, so the rise to 5.15% represents a 29-basis-point move in five trading sessions.
The yield had first pushed through 5% in late October, then eased back, before breaking above the level again in the week ending 13 November. Federal Reserve governor Christopher Waller has said the December meeting should deliver at least another quarter-point rise, with more to follow if inflation stays hot. The Fed raised its target to 3.75–4.00% on 16 September, its first increase since 2023, and held rates steady in October.
## Auctions showed softer demand
The week's government debt sales also pointed to cooler appetite for US paper. When the Treasury sold a new $42 billion 10-year note on 10 November, it cleared at a 5.020% yield with a bid-to-cover ratio of 2.46, down from 2.77 at October's reopening.
Two days later the Treasury sold $25 billion of 30-year bonds at a high yield of 5.441%, with a bid-to-cover ratio of 2.36. At the previous 30-year auction on 8 October the high yield was 5.618% and the bid-to-cover ratio was 2.54.
## Why a 5% 10-year yield matters
The 10-year yield is the benchmark for mortgage rates, corporate borrowing costs and the price investors put on shares. A 10-year Treasury now pays more than the earnings yield on the S&P 500, which sits at about 3.9% on trailing earnings, so lending to the US government pays more than the earnings stream of the stock market.
The backdrop is a large federal deficit. The government ended its 2026 fiscal year with a deficit of $2.0 trillion, equal to 6.2% of GDP, up from 5.8% the year before, according to the Congressional Budget Office. The CBO puts net interest on the public debt at $1.14 trillion in fiscal 2026.
## What to watch next
Traders will now look to the Federal Reserve's 8–9 December meeting and the next inflation figures to judge whether the 10-year yield holds above 5%. The Treasury publishes its par yield curve each business day, so Monday's reading will show whether Friday's move extends into a new week.
Sources: [U.S. Department of the Treasury, daily par yield curve rates](https://kodexius.com/data/us-treasury-yield-curve); [dpa-AFX via TradingView](https://www.tradingview.com/news/dpa_afx:70382fee2089f:0-ten-year-treasury-yield-bounces-back-to-highest-level-in-almost-a-month/). Auction and deficit figures: [AInvest](https://www.ainvest.com/news/lending-treasury-beats-owning-market-2611/). This article is not investment advice.
Source
Kodexius — U.S. Treasury daily par yield curve data — https://kodexius.com/data/us-treasury-yield-curve