What Is CPI? Consumer Price Index Explained
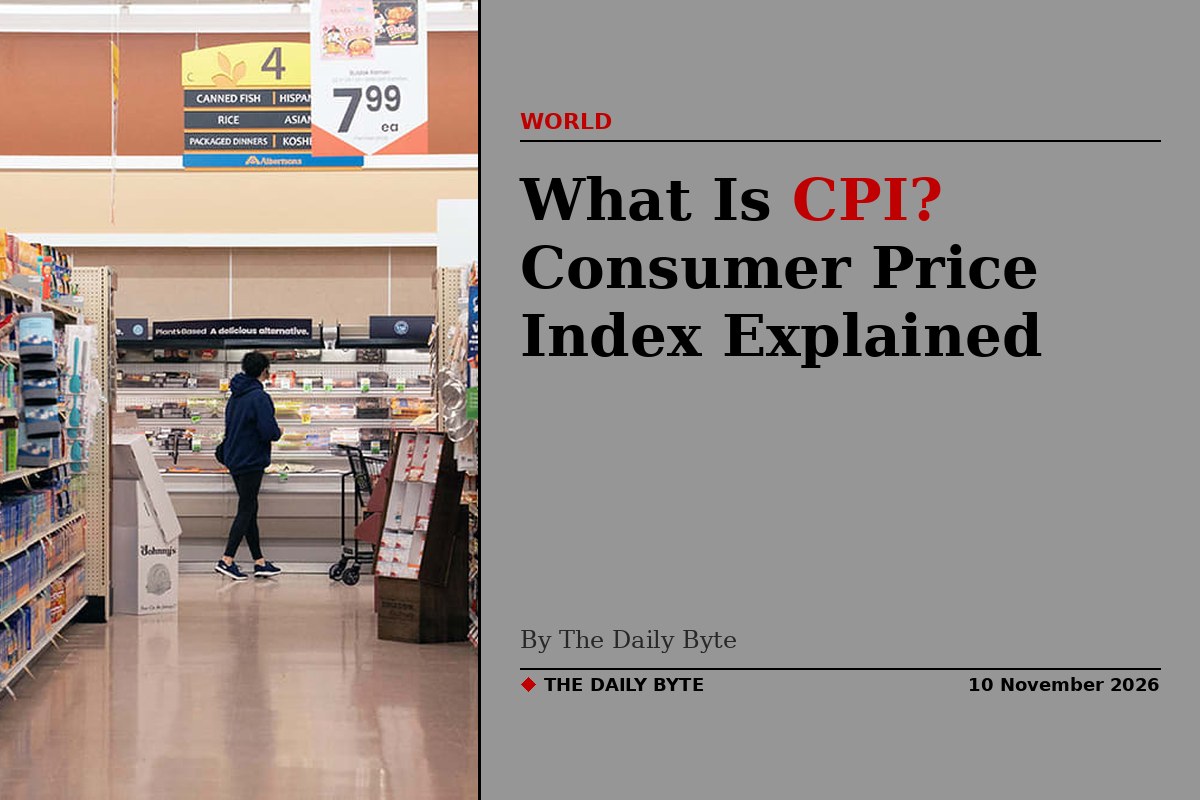
The Consumer Price Index, or CPI, is the United States' main measure of inflation: it tracks how the average price of a basket of everyday goods and services changes over time. It is published every month by the US Bureau of Labor Statistics (BLS), and it is the number behind headlines about the cost of living, interest rates and pay rises. On 10 November 2026 the latest CPI report came in hotter than expected, and markets reacted within hours, with shares falling, bond yields rising, Bitcoin dropping below $74,000 and gold falling more than 2%.
This guide explains what CPI is, how it is calculated, what core CPI means, what the October 2026 report actually showed, and why a single monthly number can move markets around the world.
What does CPI measure?
CPI measures the average change over time in the prices paid by urban consumers for a market basket of consumer goods and services. In plain terms, it answers a simple question: how much more, or less, does the same basket of shopping cost this month than it did last month, or a year ago?
The basket covers the things households actually buy. The BLS groups spending into eight major categories: food and beverages, housing, clothing, transport, medical care, recreation, education and communication, and other goods and services. Within those groups, the BLS tracks the prices of hundreds of specific items, from a loaf of bread and a litre of petrol to rent, a haircut and a visit to the doctor.
Not every item counts equally. Each item is weighted according to how much households actually spend on it, based on detailed spending surveys. Housing, for example, carries a far larger weight than clothing, because rent and home costs take up a much bigger share of a typical household budget. That is why a rise in rents moves the headline CPI number more than a rise in the price of shoes.
CPI-U and CPI-W: who is counted?
The best-known version of the index is the Consumer Price Index for All Urban Consumers, known as CPI-U. It covers about 93% of the total US population, including professionals, the self-employed, pensioners, the unemployed and people not in the labour force, as well as wage earners and clerical workers.
The second version is the Consumer Price Index for Urban Wage Earners and Clerical Workers, or CPI-W, which covers about 29% of the population. CPI-W is narrower, but it matters a great deal in practice, because it is the index used to calculate the annual cost-of-living adjustment for Social Security benefits in the United States. When CPI-W rises, millions of pensioners see their payments adjusted the following year.
For most readers, when the news says "CPI rose 0.4%", it means CPI-U, the headline index.
How is CPI calculated?
Each month the BLS collects prices from shops, service providers and households across the United States, covering the same basket of goods and services as in previous months. It then compares the total cost of that basket with its cost in a base period. The index is set so that the average of prices in 1982 to 1984 equals 100. In October 2026, the CPI-U index level stood at 337.511, which means that the basket cost roughly 3.38 times as much as it did in the early 1980s.
CPI is reported in two ways, and the difference matters. The monthly change is the change from the previous month, usually adjusted for seasonal patterns, such as the tendency for some prices to rise at particular times of year. The annual change is the change over the previous 12 months, and it is the figure most often described as "the inflation rate". A monthly rise of 0.4% sounds small, but if prices rose at that pace every month for a year, the annual rate would be close to 5%.
The BLS publishes the report at 8.30am Eastern Time, usually between the 10th and 15th of the month, covering the previous month. The October 2026 report was published on Tuesday 10 November 2026, and the November report is scheduled for Thursday 10 December 2026.
What is core CPI?
Core CPI is the same index with food and energy prices removed. Food and energy prices swing sharply from month to month because of weather, harvests, oil markets and world events, so stripping them out gives a clearer view of the underlying, persistent trend in prices.
That does not mean food and energy do not matter: they are a large part of what households actually pay, and they are included in the headline figure. But central bankers watch core CPI closely because it is a better guide to whether inflation is becoming entrenched in the wider economy, in rents, wages and services, rather than being driven by a temporary spike in petrol prices.
In October 2026, core CPI rose 0.3% for a third consecutive month, a sign that underlying price pressures were proving stubborn even as the headline rate eased from September.
What did the October 2026 CPI report show?
The October 2026 report, published by the BLS on 10 November 2026, showed US consumer prices rising 0.4% in October on a seasonally adjusted basis, after a 0.6% rise in September. Economists polled by Reuters had expected a 0.3% rise, so the figure was hotter than forecast, even though the pace of price rises had slowed from the previous month.
- All items CPI: up 0.4% in October, after up 0.6% in September. Forecast: 0.3%.
- Core CPI (excluding food and energy): up 0.3% in October, the third month in a row at that pace. Forecast: 0.2%.
- Shelter: up 0.3%, accounting for more than 30% of the monthly increase in the all-items index.
- Food: up 0.5% in October, with food at home up 0.4% and food away from home up 0.5%.
- Energy: up 0.7% in October, after a 5.2% jump in September.
- Petrol: prices were up 37.4% from a year earlier, before seasonal adjustment.
- Index level: CPI-U reached 337.511 on the 1982-84 = 100 base.
Shelter was again the biggest single driver. Rents and the cost of housing have been the most persistent source of inflation in the US in recent years, and the October report showed that pressure continuing: shelter alone accounted for more than 30% of the monthly increase. Recreation costs rose 0.8%, while transport services, hospital services and car insurance also rose, by 0.8%, 0.8% and 0.7% respectively.
Why was there no annual inflation rate in October 2026?
One unusual feature of the October 2026 report is that the BLS published no annual, 12-month inflation rate for the headline index or for core CPI. That was not a mistake, and it was not a decision to hide the figure. The bureau explained that it had not collected survey data in October 2025 because of a lapse in government funding, the federal shutdown of that autumn. With no October 2025 prices on record, it could not calculate a 12-month change for October 2026 for most series.
The last full annual reading, for September 2026, showed consumer prices up 3.7% over 12 months, with core inflation at 2.6% over the same period. A small number of series that did have year-on-year data were published: petrol, for example, was up 37.4% on a year earlier, compared with a 34.2% annual rise in September. The annual comparison is expected to return with the November report on 10 December 2026.
The missing annual figure is a reminder of how the statistics themselves depend on the government functioning normally. The 2025 shutdown did not just close offices; it left a gap in the data that is still visible in the numbers more than a year later.
Why does CPI move markets?
CPI matters to markets because it shapes what the US Federal Reserve, the American central bank, does with interest rates. The Fed aims to keep inflation at 2% over the longer run, measured by a different index, the personal consumption expenditures price index, but it watches CPI closely as the earliest and most widely reported signal.
When inflation comes in hotter than expected, traders conclude that the Fed is more likely to raise interest rates, or to keep them higher for longer. Higher rates make borrowing more expensive, slow spending and investment, and make government bonds more attractive relative to shares, gold and cryptocurrencies. That is why a "hot" CPI report typically pushes share prices down, bond yields up, the dollar up, and gold and Bitcoin down, exactly the pattern seen on 10 November 2026.
The October report landed at a sensitive moment. Federal Reserve Governor Christopher Waller had said in London, hours before the release, that the central bank should raise interest rates in December even if the data showed inflation cooling. Traders were already pricing in a near-certain quarter-point rise at the Fed's December meeting, taking rates to a range of 4% to 4.25%, according to CME FedWatch. The hotter-than-expected core reading strengthened that expectation.
The timing added to the market impact. The Federal Reserve's rate-setting committee meets on 8 and 9 December, and the next CPI report is not due until 10 December, the day after that meeting ends. That makes the October report the last inflation reading policymakers will see before they decide, which is why every tenth of a percentage point in it was scrutinised so closely.
What is the difference between CPI and PCE?
People often confuse CPI with PCE, the personal consumption expenditures price index, which is the Federal Reserve's preferred measure of inflation. Both track the prices of goods and services, but they are built differently.
CPI tracks what urban consumers pay out of their own pockets, using a fixed basket of goods whose weights change only slowly. PCE covers a wider range of spending, including healthcare paid for by employers and government programmes, and its weights adjust more quickly as people change what they buy. PCE inflation usually runs a little lower than CPI inflation. In practice, CPI is the number the public and the markets see first each month, while PCE is the number the Fed targets when it sets its 2% goal.
There is also the producer price index, or PPI, which measures the prices businesses receive for what they sell, rather than what consumers pay. PPI is published a few days after CPI and can give an early hint of cost pressures working their way through supply chains.
What is CPI used for?
Beyond markets and monetary policy, CPI has direct, practical uses in everyday life. In the United States, it sets the cost-of-living adjustment for Social Security and for many public and private pensions, so a higher CPI means larger benefit rises. It is used to adjust tax brackets, to index wages in some union contracts, and to adjust the payments in long-term contracts, leases and child support agreements. Economists use it to convert nominal figures into real, inflation-adjusted terms, so that pay, growth and spending can be compared fairly across years.
In the UK, the closest equivalent is the Consumer Prices Index, also abbreviated CPI, published by the Office for National Statistics, alongside the older Retail Prices Index. The two countries' CPIs are similar in concept but are built from different baskets and methods, so their figures are not directly comparable.
Frequently asked questions about CPI
Is CPI the same as inflation? CPI is the most widely used measure of inflation, but inflation is the general concept of prices rising over time. CPI is one way of measuring it; other measures, such as PCE and the producer price index, can give slightly different answers.
How often is CPI published? Once a month, by the Bureau of Labor Statistics, at 8.30am Eastern Time, usually between the 10th and 15th of the month, for the previous month.
What does a 0.4% monthly rise mean for my money? It means the basket of goods and services tracked by the BLS cost 0.4% more than the month before. Over a year at that pace, prices would rise by roughly 5%, which is well above the Federal Reserve's 2% target.
Why do economists look at core CPI? Because food and energy prices are volatile, core CPI, which excludes them, gives a clearer picture of whether price rises are broad-based and persistent.
Can CPI be wrong? CPI is a statistical estimate, not a census of every price, and it is revised and refined over time. It can also feel different from personal experience, because no single household buys exactly the average basket: a family that spends heavily on rent and food will feel inflation differently from one that spends more on electronics, whose prices often fall.
The bottom line
CPI is the monthly scoreboard for the cost of living in the United States: a single number that summarises the prices of hundreds of goods and services, weighted by what households actually buy. The October 2026 report showed prices still rising faster than the Federal Reserve would like, with a 0.4% monthly rise, a 0.3% core rise for the third month running, and housing doing much of the work. With the Fed's December decision now the last before the next report, that one number will shape borrowing costs, markets and household budgets on both sides of the Atlantic in the weeks ahead.
Sources: US Bureau of Labor Statistics, Consumer Price Index, October 2026 (USDL-26-1685), released 10 November 2026; Reuters, via SRN News, 10 November 2026. Figures are as published by the BLS; the annual rate was not published for October 2026 for the reasons explained above.