What Is Stagflation? Explained as the Bank of England Warns of Higher Inflation
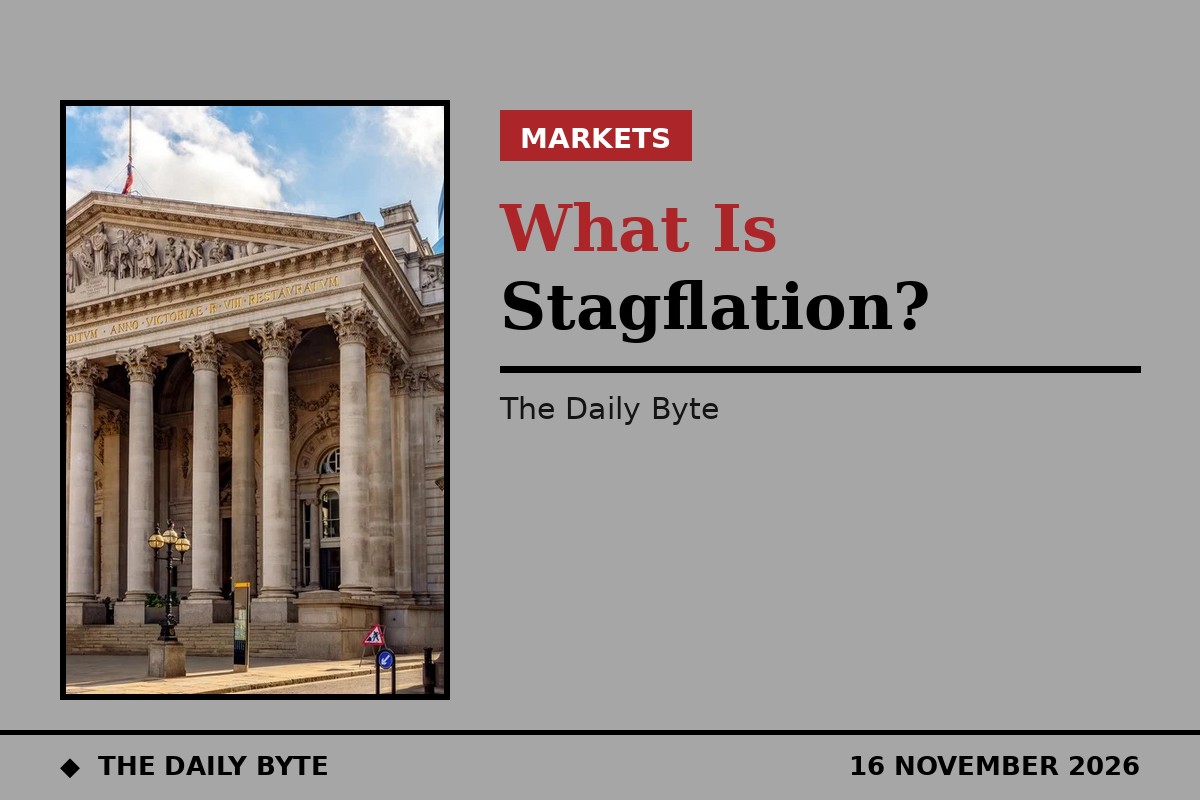
What is stagflation? It is the combination of high inflation, stagnant economic growth and elevated unemployment, all at the same time. The word is a blend of "stagnation" and "inflation", and it describes an economy in which prices keep rising even though output is barely growing and jobs are getting harder to find. It is back in the headlines in November 2026 because the Bank of England has warned that UK inflation could reach around 5 per cent by the middle of 2027, while growth stays weak — a combination the Bank itself has described as a more stagflationary outlook.
Stagflation is feared by central bankers because it breaks the usual trade-off. The standard tools for fighting inflation — raising interest rates — tend to slow growth and cost jobs. The standard tools for supporting growth — cutting rates or spending more — tend to push prices up. When both problems arrive together, every policy choice makes one of them worse. That dilemma is why the word still carries weight half a century after the 1970s made it famous.
What is stagflation?
Stagflation has three ingredients, and all three must be present. Inflation is high, so the cost of living rises quickly. Economic growth is stagnant or negative, so the economy is producing little more than it did the year before, or less. And unemployment is elevated, so more people are out of work than in a healthy economy. Any one of those on its own is a familiar problem. Together, they are stagflation.
The term was popularised — and probably coined — by the British politician Iain Macleod, who used it in a House of Commons debate on 17 November 1965 to describe an economy suffering from inflation and stagnation at the same time. Macleod later became Chancellor of the Exchequer in 1970. The word gained much wider recognition in the 1970s, when the world's major economies lived through the textbook case.
There is no single agreed threshold for when an economy counts as stagflationary. Economists look at the direction of travel rather than a fixed number: inflation well above the central bank's target, growth at or below zero, and unemployment rising. The UK's position in late 2026 illustrates the judgement involved. Inflation is above target and forecast to rise, but growth is still positive — the economy grew by 0.7 per cent in the third quarter of 2026 — and unemployment is forecast by the Bank of England at around 4.8 per cent at the end of 2026. That is a stagflationary risk, not stagflation itself, and the distinction matters.
Why does stagflation break the usual rules?
Normally, inflation and unemployment move in opposite directions. When the economy is booming, firms hire more workers and prices rise. When it slumps, firms shed workers and prices fall or rise slowly. That inverse relationship is known as the Phillips curve, after the economist A. W. Phillips, who studied nearly a century of British data. For much of the 1960s, policymakers treated it as a menu: accept a little more inflation, get a little less unemployment, and vice versa.
Stagflation breaks that menu. The usual cause is a negative supply shock — a sudden rise in the cost of something the whole economy depends on, above all energy. When oil prices jump, transport, heating, manufacturing and food all become more expensive at once, so prices rise. At the same time, higher costs squeeze firms' margins and households' spending power, so output falls and jobs are lost. Prices up, output down: the opposite of what the Phillips curve predicts.
That is what makes the policy dilemma so sharp. Raising interest rates can bring inflation down, but it does so by making borrowing more expensive, which slows spending and investment further. Cutting rates can support jobs and growth, but it leaves more money chasing the same goods and pushes prices higher still. In the 1970s, economists Milton Friedman and Edmund Phelps argued that the Phillips curve trade-off only worked in the short run, and that once people expected inflation to stay high, they built it into wage demands and price-setting — which kept inflation high even as unemployment rose. That expectations channel is one of the reasons central banks now watch wage settlements and price-setting behaviour so closely.
What caused stagflation in the 1970s?
The 1970s remains the defining case. In the United States, inflation rose from around 6 per cent at the start of the decade to nearly 15 per cent by 1980, peaking at 14.8 per cent in March 1980, while growth stayed weak and unemployment averaged roughly 6.2 per cent across the decade, reaching 9 per cent in the 1975 recession and 10.8 per cent in late 1982.
Two oil shocks drove it. In October 1973, Arab oil producers imposed an embargo, and the price of crude roughly quadrupled over the following months. A second shock followed in 1979, after the Iranian Revolution disrupted supply again, and oil prices roughly doubled. Each shock raised costs across the whole economy while cutting output — the textbook negative supply shock. Loose monetary policy before the shocks, and rising inflation expectations once they hit, made the episode worse and longer.
The episode ended only after a deliberate and painful tightening. Paul Volcker, appointed chair of the US Federal Reserve in 1979, raised the federal funds rate to around 19 to 20 per cent by 1981. The move broke inflation expectations, and inflation fell to around 3 to 4 per cent by 1983 — but only after the deep recession of 1981 to 1982, in which unemployment reached 10.8 per cent. The lesson central bankers took from the 1970s was that allowing an energy shock to become embedded in wages and prices is far more costly than acting early, even if acting early hurts.
| Condition | Inflation | Growth | Unemployment |
|---|---|---|---|
| Stagflation | High | Stagnant or falling | Elevated and rising |
| Ordinary inflation | High | Strong | Low |
| Recession | Low or falling | Falling | Rising |
| Healthy growth | Near target | Steady | Low |
Why is stagflation in the news in November 2026?
The immediate trigger is the Bank of England. At its meeting ending on 4 November 2026, the Monetary Policy Committee voted by 8 to 1 to raise Bank Rate by 0.25 percentage points to 4 per cent, its first increase since August 2023. One member, Catherine Mann, voted for a larger rise, to 4.25 per cent. The Bank said the rise was warranted by higher energy prices stemming from the conflict in the Middle East, which is now in its ninth month.
The forecasts published with the decision are what revived the stagflation debate. UK consumer price inflation had already risen to 3.5 per cent in September 2026, and the Bank's November Monetary Policy Report expects it to rise to around 5 per cent by the middle of 2027, with the central projection averaging 4.9 per cent in the second quarter of 2027, before falling back towards the 2 per cent target by the third quarter of 2028. In the Bank's adverse scenario, in which energy prices rise sharply again and stay elevated, inflation peaks at 6.2 per cent in the third quarter of 2027 and stays above target throughout the forecast period.
At the same time, the Bank expects growth to stay modest — its central projection sees UK GDP growth of 1.0 per cent in the year to the fourth quarter of 2027, down from 2.2 per cent in the year to the fourth quarter of 2026 — and unemployment edging up, from 4.8 per cent at the end of 2026 to 5.0 per cent at the end of 2027. Higher inflation, weaker growth, softer jobs: that is the stagflationary mix, even though the UK is not in stagflation today.
The Bank's chief economist, Huw Pill, underlined the point on 14 November 2026, telling the Financial Times that the Bank will probably need to raise interest rates further in 2027, over and above an increase expected at its next meeting on 17 December. Markets were pricing around 90 basis points of further tightening by the end of 2027, implying Bank Rate could approach 5 per cent. The Bank itself stressed that policy is not on a pre-set path, and that its decisions will depend on whether higher energy prices feed through into wages and prices — the "second-round effects" it says have so far shown only limited evidence of emerging.
The pattern is not confined to the UK. Japan's economy contracted by an annualised 0.1 per cent in the third quarter of 2026, government data showed on 16 November, as private consumption fell 0.3 per cent and net exports subtracted 0.6 percentage points from growth — while prices stayed above the Bank of Japan's 2 per cent target. Weak growth with persistent inflation is the combination markets are watching in more than one major economy.
Is the UK in stagflation now?
No — not on the evidence available in November 2026. Stagflation requires stagnant growth and elevated unemployment alongside high inflation, and the UK does not yet meet the first two conditions. The economy grew by 0.7 per cent in the third quarter of 2026, and the Bank's own central projection still has growth positive, at 1.0 per cent in the year to the fourth quarter of 2027. Unemployment, at around 4.8 per cent, is low by historical standards.
What the UK does have is a stagflationary outlook: inflation forecast to rise well above target while growth slows and the labour market softens. Analysts describing the November Monetary Policy Report as presenting "a more stagflationary outlook, with higher and more persistent inflation alongside weaker medium-term growth" are describing the direction of the forecasts, not the current state of the economy. If energy prices fall, or if the second-round effects the Bank fears do not materialise, the inflation peak could be lower and the growth outlook better. If energy prices rise again, the adverse scenario — 6.2 per cent inflation with tighter policy — becomes more likely. The honest answer is that the risk has grown, not that the condition has arrived.
What does stagflation mean for households, savers and borrowers?
For households, stagflation is the worst of both worlds because it squeezes from two sides at once. Prices rise faster than pay, so real incomes fall, and at the same time jobs become less secure, so the income itself is less certain. In the UK in late 2026, the squeeze is visible in the Bank's own figures: inflation at 3.5 per cent in September, with household energy bills and motor fuel accounting for around 60 per cent of the overshoot above the 2 per cent target, and diesel and petrol pump prices around 40 per cent and 30 per cent higher respectively than before the Middle East conflict began.
For borrowers, higher Bank Rate feeds through to mortgages and other lending, although the pass-through is gradual for people on fixed-rate deals. For savers, higher rates can mean better returns on cash, but only if the rate on savings keeps pace with inflation — if prices rise at 5 per cent and savings pay 4 per cent, the real value of the money still falls. For businesses, the dilemma is the same as for the central bank: raise prices and risk losing customers, or absorb higher costs and watch margins shrink. The Bank's Agents reported that firms had so far absorbed some of the rise in energy costs by accepting lower margins, but that cannot continue indefinitely if energy prices stay high.
None of this is personal financial advice, and individual circumstances differ widely. The general point is that stagflation punishes both spending and saving at the same time, which is why it is described as a central banker's nightmare — and why the Bank of England is acting before the second-round effects it fears have fully appeared.
How does stagflation end?
History offers two routes out, and both are slow. The first is a fall in the price of whatever caused the supply shock — in the 1970s, that meant oil; today, it would mean energy prices easing as the conflict in the Middle East is resolved or as supply adjusts. The Bank's central projection assumes energy prices follow market futures curves, which slope downward, and that is a large part of why it expects inflation to fall back towards 2 per cent by the third quarter of 2028.
The second route is monetary policy breaking inflation expectations, as Volcker did in the early 1980s — at the cost of a deep recession. The Bank of England's November decision is a much smaller version of the same logic: raise rates now, signal that further rises are possible, and try to prevent a temporary energy shock from becoming a permanent change in how firms set prices and workers bargain for pay. Whether it works without a recession depends on the two judgements the Bank set out in its report — how strong the inflationary pressure in the pipeline turns out to be, and how resilient demand proves to be in the face of higher prices and tighter policy. Both are still open questions, and both will be tested by the data due before the Bank's next decision on 17 December.
Frequently asked questions
What is stagflation in simple terms? It is when prices rise quickly, the economy barely grows or shrinks, and unemployment is high — all at the same time.
What causes stagflation? Most often a negative supply shock, such as a sharp rise in oil or energy prices, which raises costs across the economy while cutting output. Rising inflation expectations and policy mistakes can make it worse.
Is the UK in stagflation in November 2026? No. Inflation is high and forecast to rise to around 5 per cent by mid-2027, but the economy grew by 0.7 per cent in the third quarter of 2026 and unemployment is around 4.8 per cent. The Bank of England describes a more stagflationary outlook, which is a warning about the direction of travel, not a diagnosis of the present.
How is stagflation different from a recession? In a recession, output falls and unemployment rises, but inflation usually falls too. In stagflation, inflation stays high even as output stagnates and jobs are lost, which is what makes it so hard for central banks to treat.
How did stagflation end in the 1970s? The US Federal Reserve under Paul Volcker raised interest rates to around 19 to 20 per cent by 1981, breaking inflation expectations. Inflation fell to around 3 to 4 per cent by 1983, after the deep recession of 1981 to 1982.
Sources: Bank of England, Monetary Policy Report, November 2026 (verified 16 November 2026); Charles Schwab, "What Is Stagflation?"; Reuters, 14 November 2026, via reporting of Huw Pill's Financial Times interview; Cabinet Office of Japan GDP data, 16 November 2026, via Reuters. This article is general information, not financial advice.
Bank of England: Monetary Policy Report, November 2026 | Charles Schwab: What Is Stagflation? | Reuters: Bank of England likely to raise rates further in 2027, Pill tells FT